Satperf utilizes a visualization framework called Grafana, to present graphs.
Metrics Collected
An explanation of how the following metrics are placed in the satperf monitoring dashboard, is described in the ‘Grafana Dashboard’ section. If you wanna copy these metrics, refer to this file [2] in references
- The panels that satperf monitoring module provides:
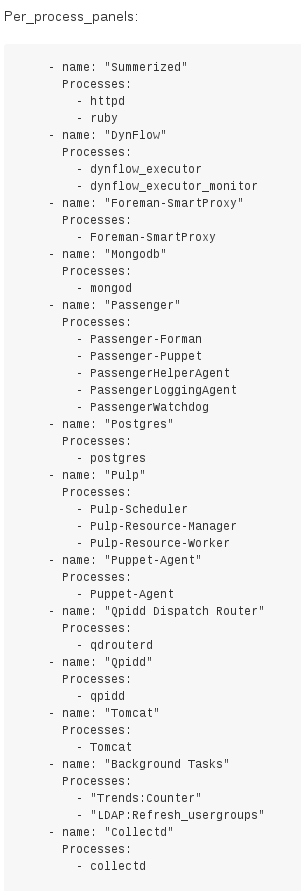
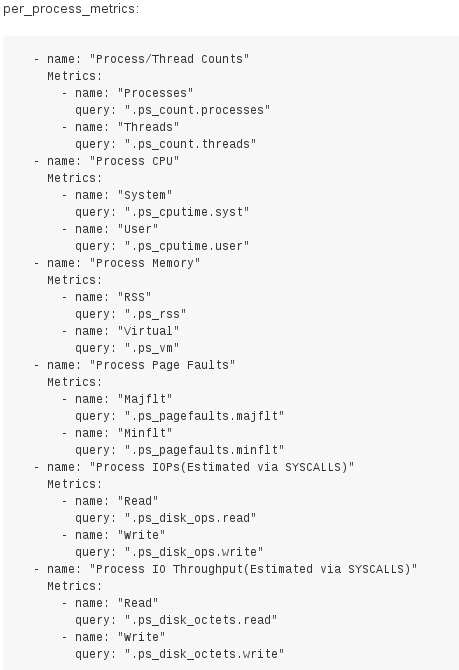
- The metrics that satperf monitoring module collects for processes:
Overview
The Grafana dashboard is divided into rows and each row has either a single or multiple panels. Each of those panels query specific metrics. Here’s how those metrics in the template [1] are grouped:
- Grafana variable templating
- Rows > Panels > Queries
The rows are named as following:

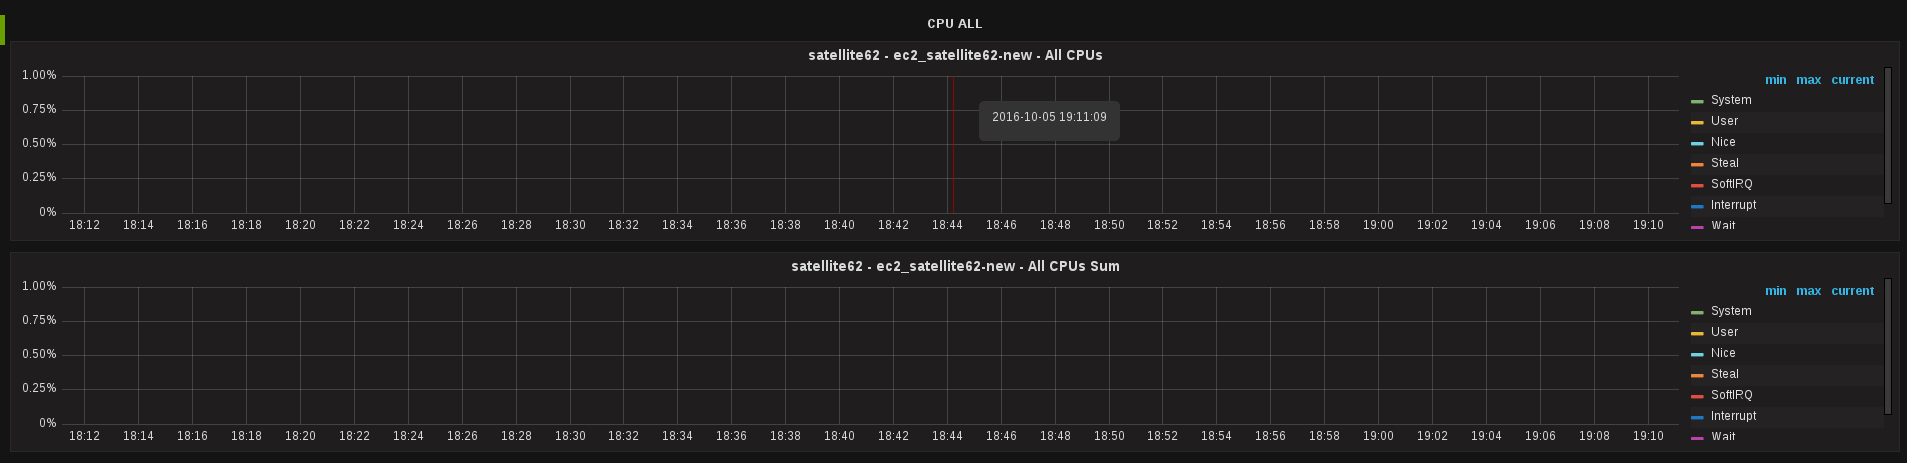
A sample “CPU ALL” row with all panels:
On clicking edit in one of the panels in that row, we get the metric query frame, like this:
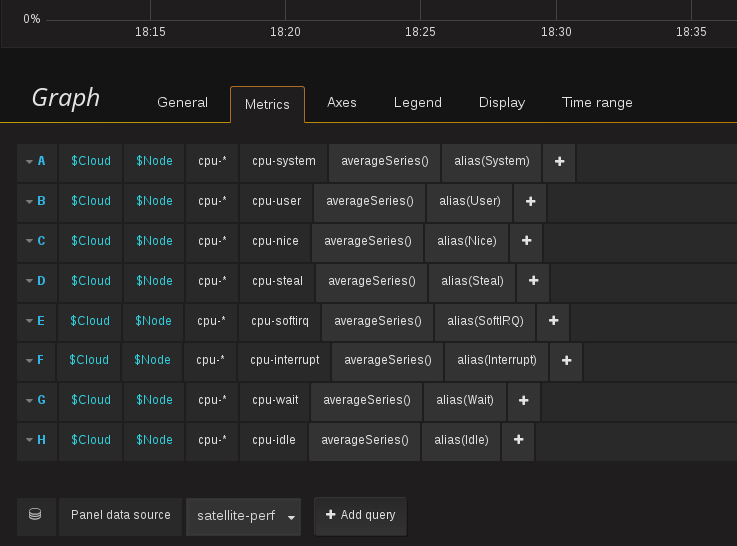
The templating $Cloud, $Node etc.. are included at the top of the dashboard, like this:

Grafana Dashboard
- Satperf Dashboard template can be obtained here
- Variables replaced in that template are in this file
Satperf Dashboard templating explained
So in the jinja template [1], we have multiple “title”(s) under “rows” section and variables from [2] are replaced inside the template as illustrated in following piece of that jinja template:
1
2
3
4
5
6
7
8
9
{# Loop over per-process options here #}
    {% for metrics in per_process_metrics %}
      {
        “collapse”: true,
        “editable”: true,
        “height”: “200px”,
        “panels”: [

      {% for panel in per_process_panels[item.process_list_name] %}
Additionally, "title": "CPU All" in the dashboard template [1] refers to one row of the dashboard.
Note: This post is a spin off from the main satperf project.
- To take a look at how satperf works, refer to this post
- To learn how to setup monitoring for the parameters covered in this post, refer to this post