Intro
Installing collectd could be trivial, although setting up monitoring for continuous time-series metric collection should be simpler. This post is aimed at helping sysadmins setup collectd and connect it to a graphite instance, so that all those metrics could later be viewed from Grafana instance.
Note:
This post is a spin off from the main satperf project. To take a look at how satperf works, refer to this post
The process
Step 1
Install collectd for your system, Install Graphite server elsewhere (recommended: separate machine).
Step 2
When that’s installed, take a look at your /etc/collectd.conf and add plugins from the list below, as suitable
1 2 3 4 5 6 7 8 9 10 11 12 13 14 15 16 17 18 19 | |
Note:
If you’re installing this on Red Hat Satellite, you might wanna make additional changes as per this template in satperf
For others, you might wanna take a look at the above mentioned link anyway, for it serves as a generic reference for
/etc/collectd.confReplace variable names in above referenced satperf’s
collectd.confas per following defaults / or change them as suitable:
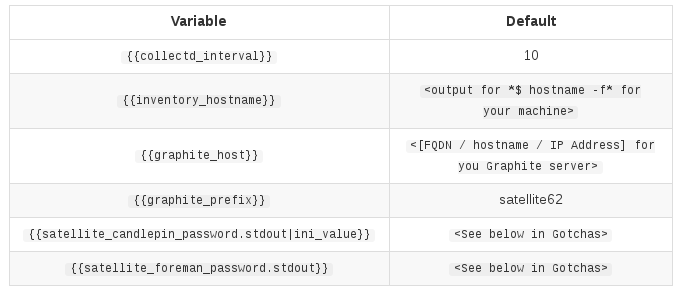
Gotchas (for both Satellite setup as well as normal setup):
1) 10 refers to 10 seconds
2) end results on graphite-web UI show under Metrics:
1
| |
3) For candlepin password:
1
| |
4) For Satellite Foreman password:
1
| |
Step 3
Once this is done, reload collectd server and check logs on graphite server to make sure you’re able to receive data
Other Gotchas:
- Use
iptables -Fif unable to send collectd metrics - To graph the other parameters in Grafana, this satellite generic dashboard file
- To simply look at which metrics are touched in above dashboard template, refer to this satperf vars file
- FYI, I’ve got an open PR to add collectd info to sos report, as a plugin
- I’ll add some screenshots to this post ASAP.