1. What is it about?
Sarjitsu, or, SAR Jitsu, is a one stop shop for people who’re looking to visualize their system data, based on System Activity Report (SAR) data generated by Sysstat. Screenshots from the app are near the end of this post.
1.a. How do I get cracking on the source?
It has been open sourced under Distributed System Analysis efforts. Take a look!
2. What does it offer?
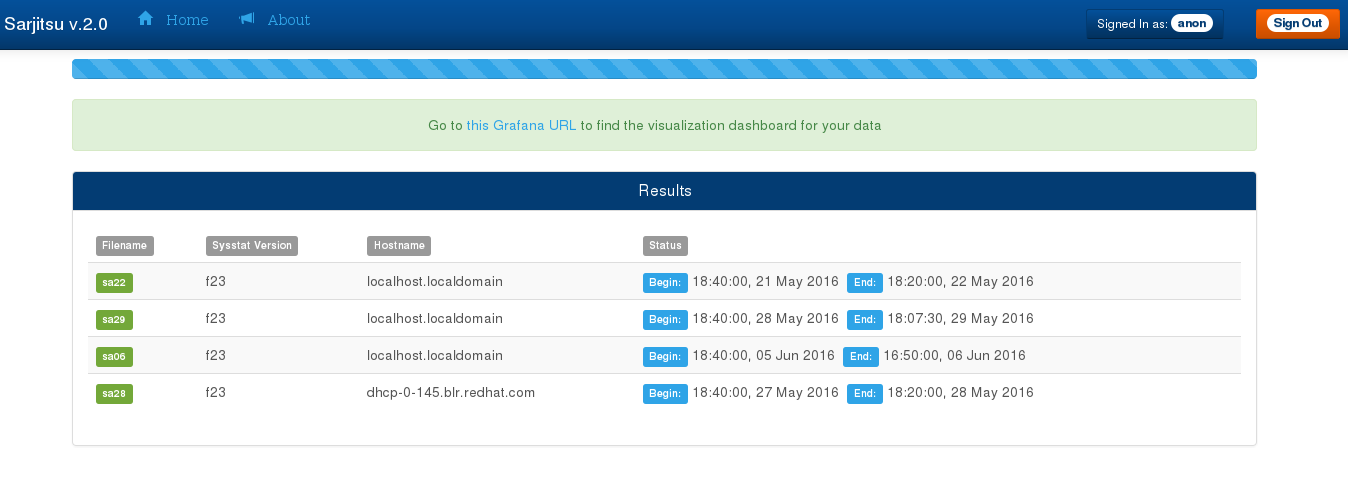
It includes throwing SA binary files at an instance of sarjitsu’s web app and extracting the following valuable information out of it:
- Nodename of the machine whose data is contained within the binary
- Time range of the data collected
- Extraction of the time series data and visualization in a feature rich dashboard using Grafana
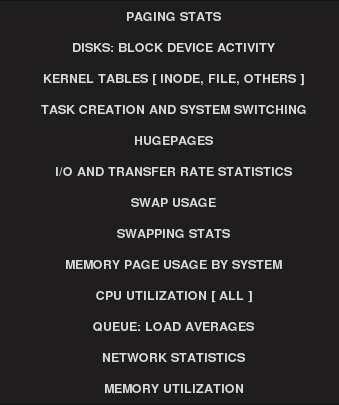
- Graphing of the following parameters:
3. How is it different from live monitoring ?
Sometimes issues can’t just be detected out of live monitoring and we might need to use historical data. For live monitoring, already tools like collectd exist. If you’ve got your data stored in form of SA binary file, Sarjitsu can visualize it.
Sarjitsu would enable you to:
Debug issues with your machine by presenting time series data collected on a minute’s granularity level. This is entirely configurable through the SAR setup that your system has.
Figure out where the bottleneck lies by presenting all the information under a common y-axis and correlate results
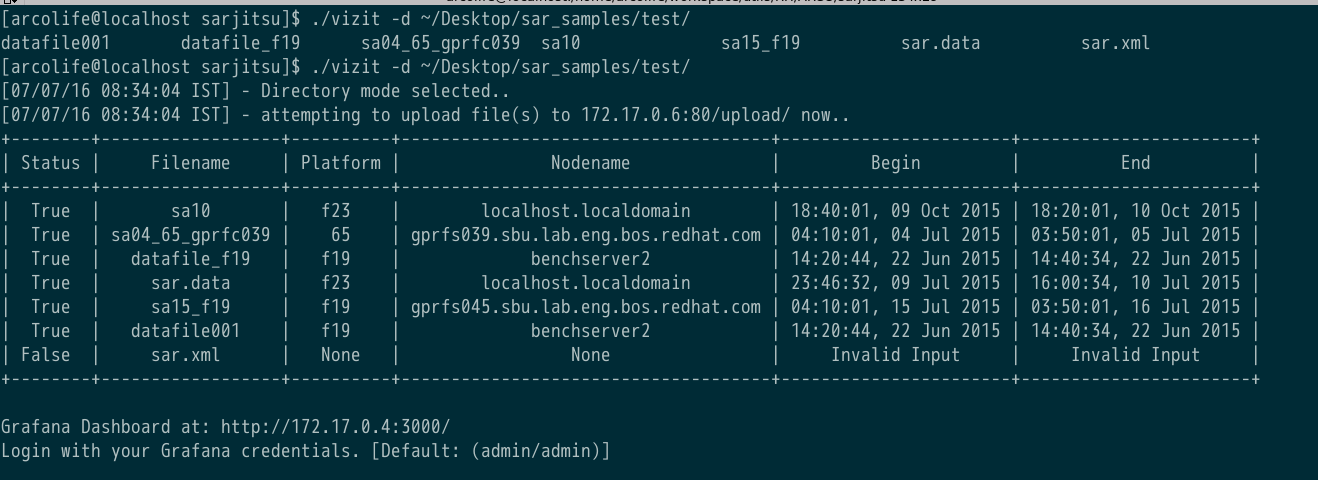
Visualize pbench results (additional feature). It comes with a command line tool which you could point to results dir of a pbench run and it will find all the
sar.datafiles and visualize them.
4. Ok. Tell me more about..
It is built in a manner so that it could scale up real fast, because of it’s ease of use and also because it is based on Docker containers, around which a whole ecosystem exists on scaling up. If you’re willing to use this in production, send us a holler and we’ll get back to you. (Refer to the section at the end.)
4.a. Software Stack
- Docker containers
- Python-Flask + uWSGI
- Nginx
- PostgreSQL
- Redis
- ElasticSearch
- Grafana
- Twitter Bootstrap
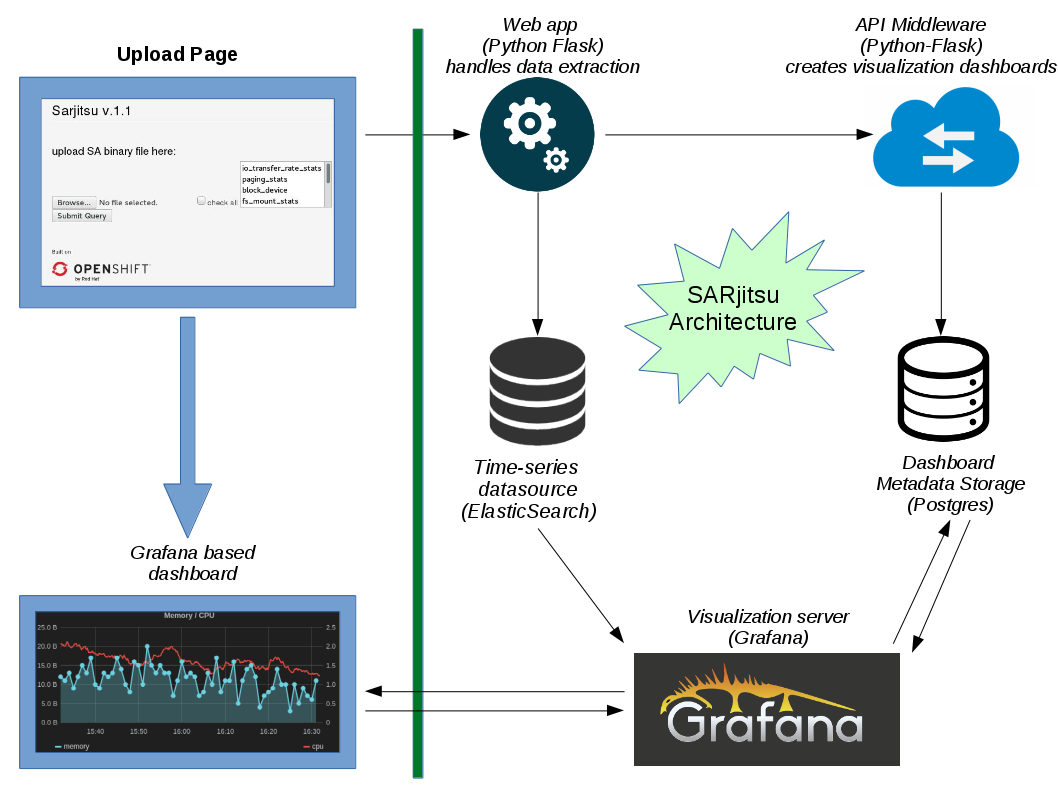
4.b. Architecture
The project is divided into 5 components:
- Grafana for visualizations
- Postgres (used for storing Grafana’s dashboards)
- Elasticsearch (used as a data source)
- API Engine in Python-Flask
- Web Server in Python-Flask (previously written in NodeJS)
5. Project Status
The project development status is still in alpha mode, since there have been a lot of drastic changes over the past year. In fact, I’m still waiting for a few to be included in core of grafana’s code (PR #4694 that I’ve submitted). In fact, earlier last year, I had released an elasticsearch-graphite shim of sorts, that made it possible for data to be sourced from ES into Grafana. Later on though, the native support was included and I had to move on. (Yeah it was difficult to let go of the python-django project!).
The usage of nested documents within grafana, sourced from elasticsearch, depends on presence of this feature (PR #4694). Of course though, if someone is willing to make a Fedora Copr based custom packaging out of this project, I’d be really really glad and might even invite you to my annual Great Gatsby themed party.
Once again, checkout the project at DSA and please contribute! :)
5.a. Upcoming features
- Statistics about top N devices. Example: CPUs, Disks or Network devices.
- Options to integrate this with hybrid cloud ecosystem.
Service Discovery for individual components.
Of course it’s only as good as you make it.
So more on this later. Feel free to open a feature request on github and maybe even send a PR!
6. Contributions
I’ve opened a list of issues and labelled them accordingly on this Github issues list for Sarjitsu. Feel free to start a discussion under a github issue’s comments section, or submit a Pull Request for it. Cheers and happy debugging!
We hangout on #pbench under FreeNode on IRC. Feel free to ping me there or tweet about it (I’m @arcolife).
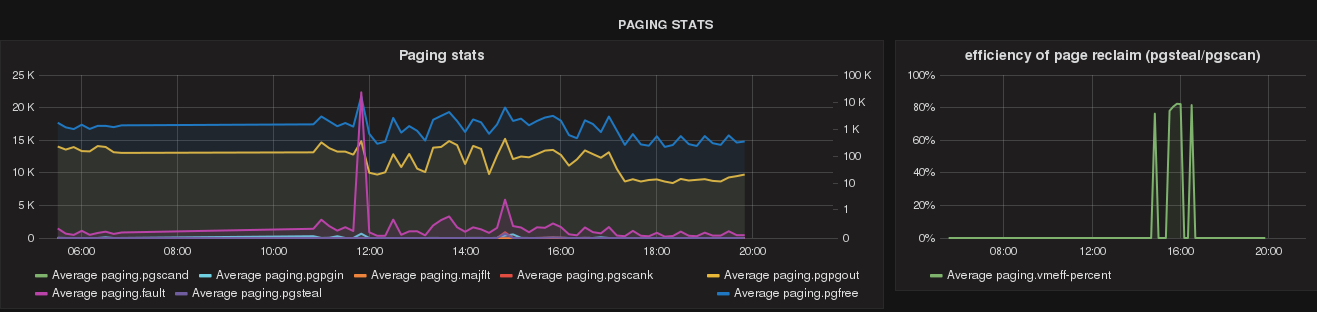
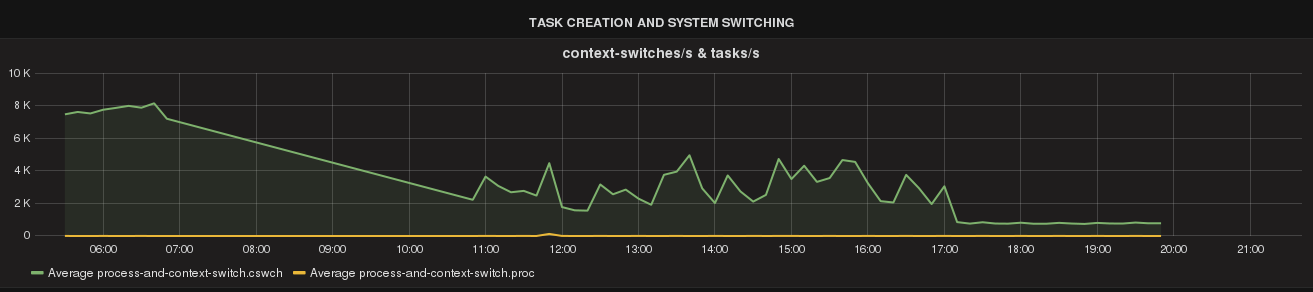
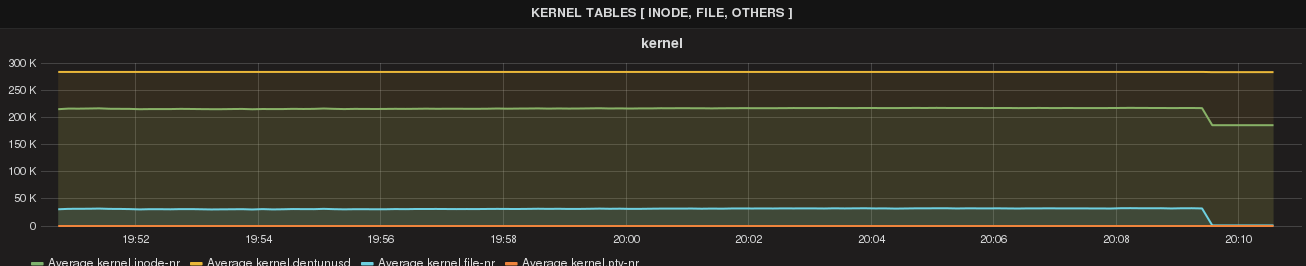
7. Screenshots from app
- Landing Page

- Results Page
- Commandline uploader sample
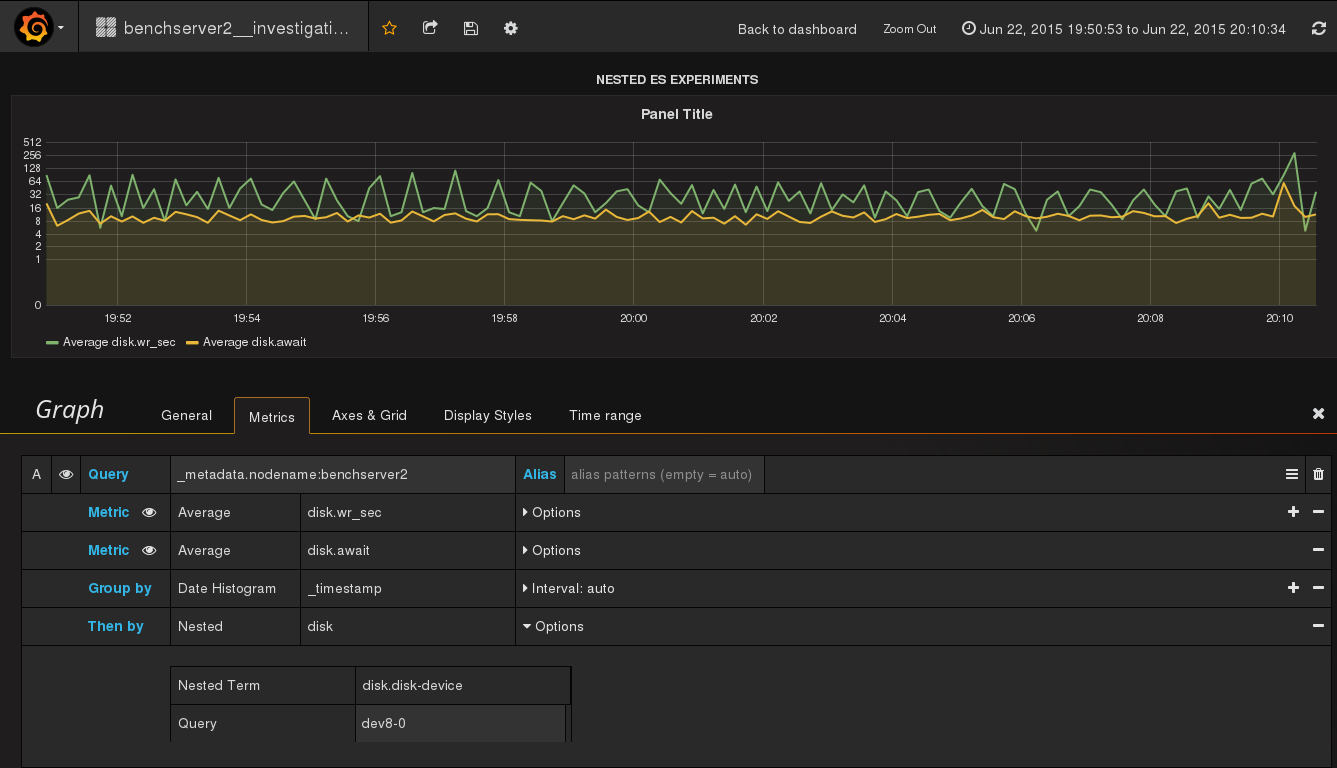
- Grafana Dashboard
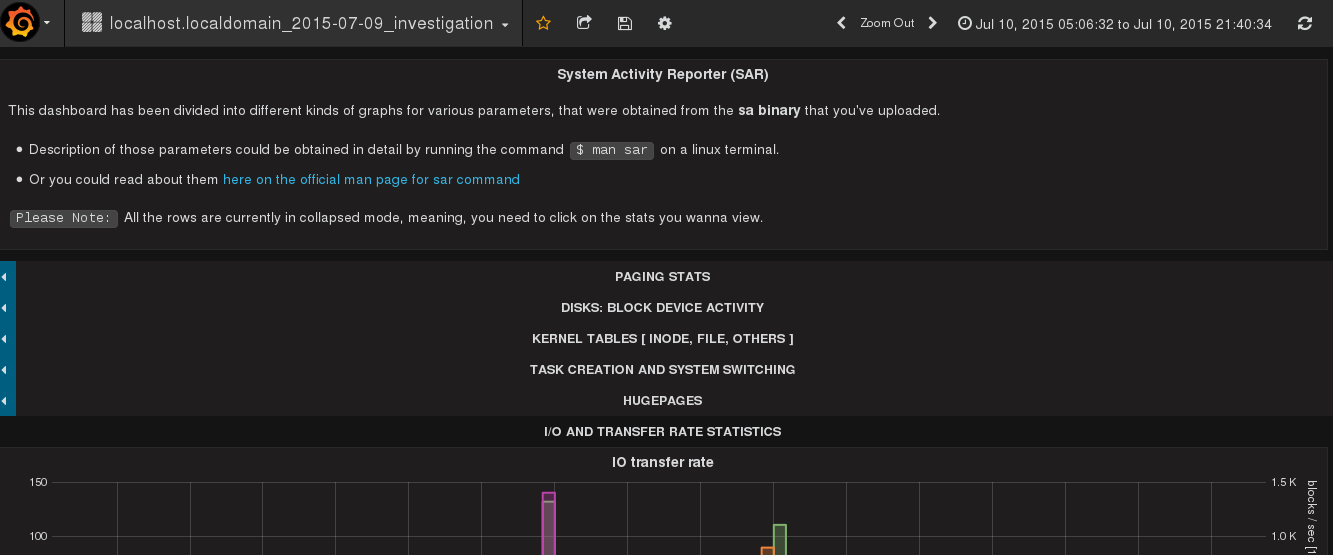
- Grafana Visualization example
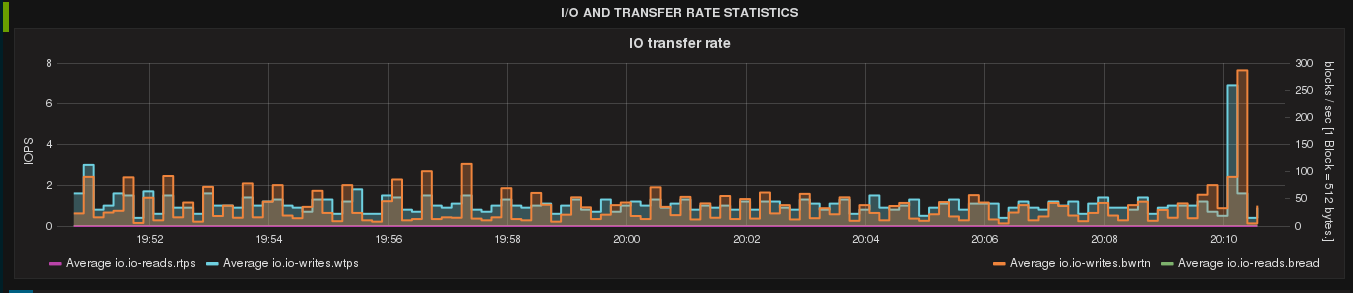
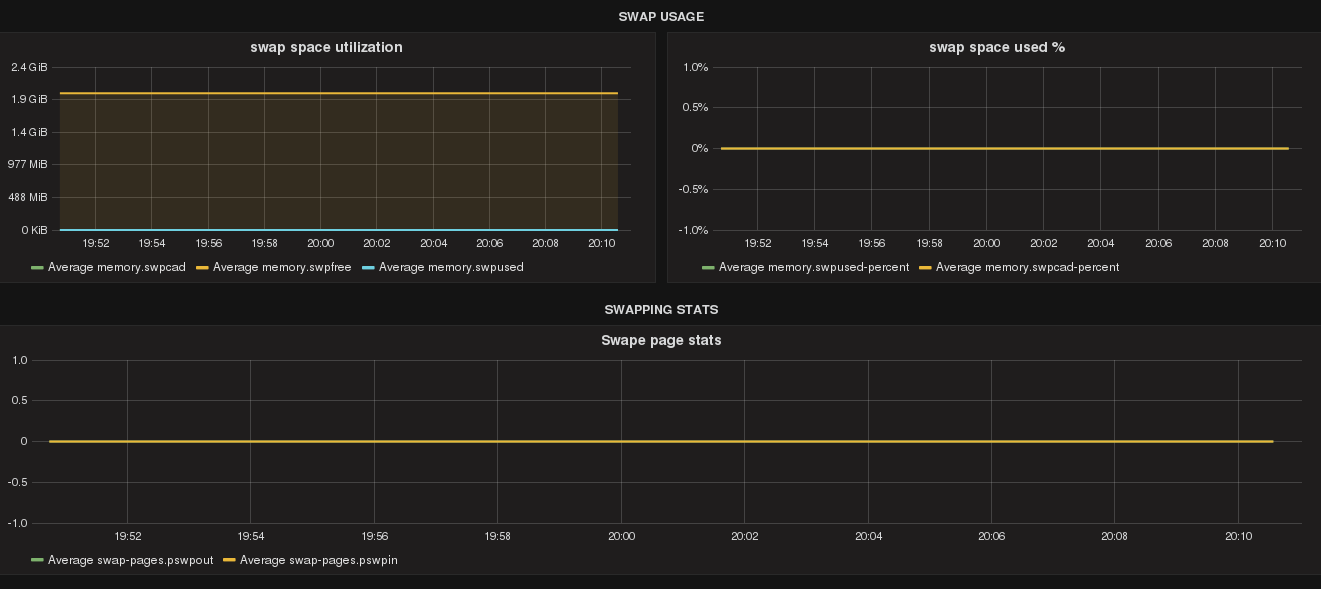
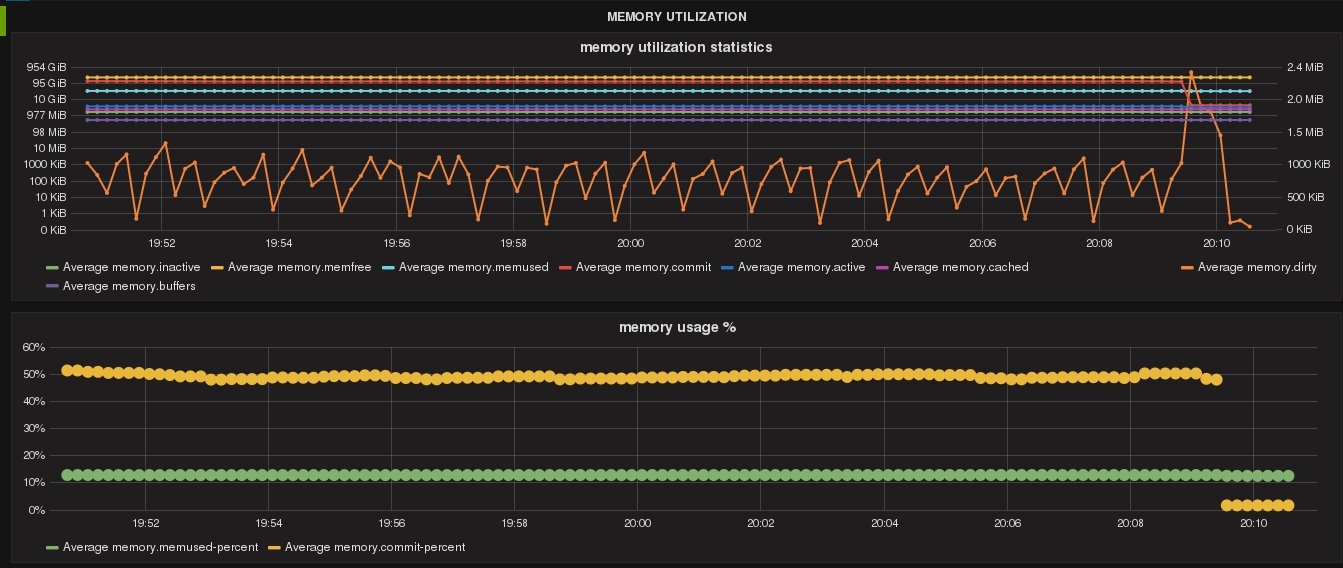
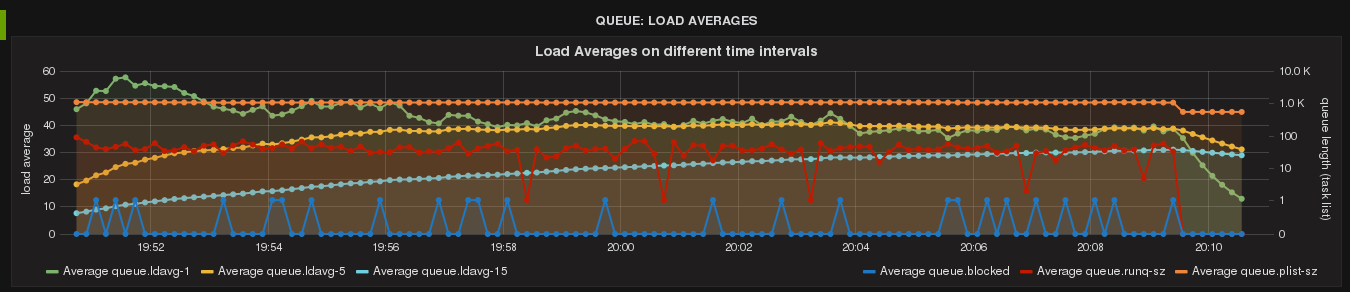
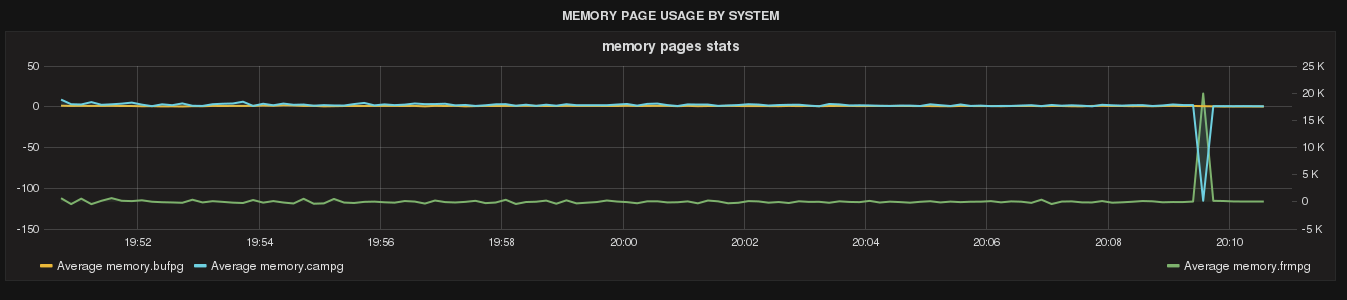
- This one is a demo of the upcoming nested docs feature.. refer to Grafana’s PR #4694 for more:
8. Last but not the least
If you think there is a significant improvement possible to the architecture of this project, or a potential collaboration opportunity with one of your own projects, contact us right now and we could take this further. Refer to this page on more info about contacting me or say hello on #pbench under FreeNode on IRC.
With Love,
- Team DSA